Understanding the level of foot traffic at specific locations around your area is very useful in determining where the potential for success is greatest and where you want to park your food truck from day to day. You should be very interested in researching this information. To do it on your own, follow these steps to calculate foot traffic in the areas where you’re interested in operating.
Foot Traffic Calculations
 Determine when you plan to be open for business and calculate the foot traffic during these time periods at each location you want to investigate.In all likelihood, every location’s foot traffic will vary at different times, so make sure to count traffic over a slightly longer period than your target time (15 to 30 minutes before and after your planned operating hours).If you’ll be able to stay in one location for multiple work shifts, it may be in your best interest to count traffic for the entire day to hone in on the best times to operate.
- Put together a foot traffic grid worksheet with each of your selected time periods listed down the left-hand side, and list different classes of pedestrians along the top, such as elderly, adults (with and without children), and bicyclists.Use five-minute time increments to allow an accurate profile to be calculated at the end of the process.
- Find a safe location from which to observe pedestrians, and identify a visual reference point, such as a parking meter.
- Put a tick in the appropriate pedestrian class box every time someone passes your reference point during a given time period. Pay attention to small groups of three to eight people, which can make or break a stop. Food trucks are innately social, and people like to go to them with their friends.
- Repeat this counting until the entire window of time (for example, 11:45 a.m. to 1 p.m.) has been completed.
- After you have your numbers, total the columns and rows for each time slot and class of pedestrian. The column totals allow you to see whether one specific class has the potential to generate a particularly high demand over the entire time window. This data can be used for a variety of purposes, such as planning your menu for each time window.The row totals identify overall demand during each five-minute period and provide an accurate profile of the traffic totals. Understanding this data may even help to confirm whether each location you’re considering fits the customer base you’re striving to attract to your truck.
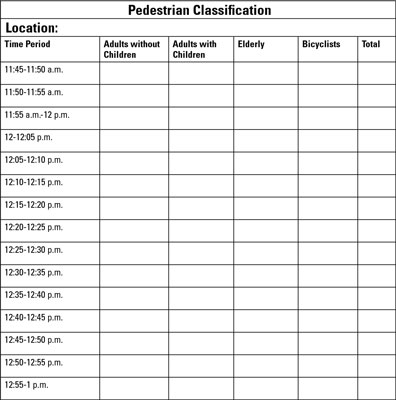
Example Chart
Here’s an example of what your foot traffic chart may look like. This is for a time span from 11:45 p.m. to 1 p.m. (your chart, of course, would cover a longer time span; this is a condensed version).
Looking At Multiple Locations
If you have multiple locations to check out, you can repeat this process. Look at foot traffic for each spot and then compare the locations and consider the best times to operate in each place. Many trucks are in large enough cities to conduct lunch and dinner operations five days a week without repeating a single location each week, whereas others operate the same amount of time but park in only one or two locations each week.
If you find the perfect street spot to operate your truck, but the spot gets taken long before the time period you plan to operate, you can hold the parking spot with another car until your food truck arrives. This way you’re guaranteed a spot for the day.
RELATED: Planning Ahead For Your Food Truck’s Future Success
Do you have any tips for calculating foot traffic? Share your thoughts in the comment section or social media. Twitter | Facebook