Need a marketing slogan to help promote your food truck? I’ve put together more than 200 ideas you can use or adapt for your own mobile food unit.
To start a food truck business, you’ll may only need $50,000 worth of starting capital. The lower startup cost is fantastic if you’re on a budget, but it also means there are lower barriers to entry for other food trucks to startup. This means you’ll need to rely on your marketing skills to help stand out from the herd. Here are some ideas for taco, ice cream, pizza, and other food truck concepts to promote their businesses.
Page Contents
- Food Truck Marketing Slogan
- Marketing Slogans for Taco Trucks
- Marketing Slogans for Ice Cream Trucks
- Funny Food Truck Slogans
- Dessert Food Truck Slogans
- BBQ Food Truck Slogans
- Pizza Food Truck Slogans
- Waffle Food Truck Slogans
- Burrito Food Truck Slogans
- Italian Food Truck Slogans
- Asian Food Truck Slogans
- Filipino Food Truck Slogans
Food Truck Marketing Slogan
Here are general food truck marketing slogans that will fit any menu.
- The way to your heart is through this food truck.
- Sumptuous meals on wheels.
- Telling everyone’s story through food.
- Chase your dreams. Chase your craving.
- Where you go, I go. Where you stay. I stay. Where you eat, I cook. I will follow you.
- Your order is my command.
- Have you decided what to eat next?
- Next stop: your place.
- Your place, my kitchen.
- It’s a date!
- Everywhere is an ideal place to eat.
- We cook it the way you like it.
- The food. The truck. The memories.
- The tongue remembers.
- I know your favorite.
- Different place. Same vibe.
- Have we met before?
- Can you come pick me up?
- Don’t keep your taste buds waiting.
- Listen to your tummy.
- Good to see you again!
- Come find me.
- Ride. Fried. Tried. Satisfied.
- Have a seat.
- Come with us.
- We turn your kitchen nightmares into dining daydreams
- May I take you out on a date?
- The world is my kitchen.
- Bringing the world to you.
- Just stay there, I’m coming.
Marketing Slogans for Taco Trucks
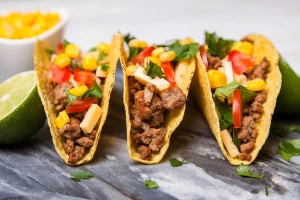
Healthy crispy bites with Taco!
Taco trucks operate in nearly every market of the United States. Help your taco truck or trailer standout with these marketing messages.
- Ten times fold better with taco and outside get-together.
- Wrap your hands with taco wrappers.
- Tell your friends I got tacos!
- If you’re lost, find some tacos.
- Taco on the go!
- Taco conquers hunger as love conquers all.
- Go, Grow, Glow with Taco.
- Tango with taco
- Did you say taco? I heard you say taco.
- Tuck a taco, no one has to know except everyone you know.
- I’ll taco to wonderland.
- I’ll taco with me.
- Taki taki. Taco taco.
- Spell taco with your tongue.
- Fold me nicely.
- Adventure? More like Taco-venture!
- Track your taco.
- Taco dreams at your doorstep.
- I’ll give you tacos later.
- Talk to my taco.
- Take a seat, take a taco.
You Might Like: 200+ Unforgettable Spring Marketing Slogans that Get Results
- Come back for more tacos.
- I brought you tacos.
- Take a chance, taco next step.
- Tacos on the wheels go round and round!
- Taco town won’t let you down.
- Talk to you later, taco soon.
- Spreading good vibes and taco everywhere.
- Tell your friends I said taco–I mean, hi.
- Taco happiness. Taco madness.
Marketing Slogans for Ice Cream Trucks
Who doesn’t like ice cream? Whether it’s sunny days or Sunday afternoons, you’re in for a treat! Here are slogan ideas for your ice cream truck.

What’s your favorite flavor?
- Does it ring a bell?
- Lick. Laugh. Love.
- Beat The Sun On The Streets.
- I cone not get enough of you.
- Tasty Scoop On Streets.
- Hurry, it’s melting!
- Summer is coming. Do you know what that means? More Ice cream!
- Scream for Ice cream.
- Nice dream rhymes with ice cream.
- 1 like = 1 ice cream
- Cold, creamy days don’t go away.
- One scoop is not enough.
- Heavenly taste for an angel like you.
- Let’s melt under the sun!
- Melt my heart, melt in my tongue.
- Different place. Different flavor.
- Scoop me baby, one more time!
- Scoop a mood.
- Find happiness. Find ice cream.
- I love your smile.
- I’ll save you a scoop.
- Scoot over. Scoop ice cream.
- Meet and lick me at the park.
- Playground. Memories. Ice Cream.
- I’ll move mountains and cross rivers for an ice cream.
- Ice cream worth screaming for.
- Frozen treats for your warm tongue.
- Be a child again.
- Childhood happiness in three scoops.
- Poured my ice, cream, and happiness for you.
- A cone of smiles, a cup of tea, a cart of ice cream.
- Trick or cream!
- Comfort food in your comfort zone.
Funny Food Truck Slogans
Operating a food truck can be a lot of fun. Why not make a funny food truck slogan to go along with it?
- Wheel you eat with me?
- The way to your tummy’s heart.
- If you’re about to burn the kitchen, call the food truck.
- If you ran out of food, walk your way to us.
- If they can cook, you can call us.
- AFK: Away from the Kitchen
- Kitchen later, alligator!
- Nice door. Open up.
- On my way to calm your rumbling tummy.
- What’s your food emergency?
- “Knock, knock!” “Who’s there?” “Your food.”
- You’d wish you could feed your wallet, too.
- Never too full for an outdoor meal.
- I’m already full. Nah, I’m just kitchen.
- Kitchen believe how good it tastes?
- Moving your kitchen to a safer place.
- Your kitchen is in good hands.
- Don’t talk if your mouth is full–keep eating.
- I heard your tummy rumbled, so here I am!
- You save the date, we save the day.
- You’d come back before you leave.
- You are what we cook.
- Stay where you are, we’re coming.
- Near or far, wherever you are.
- Sizzling the song of your tummy.
- Tummy wants, tummy gets.
- We’ll travel for you.
- Call and we shall deliver!
- You have feet, we have wheels. We should dine sometimes.
- Eye see truck. I want food.
Dessert Food Truck Slogans
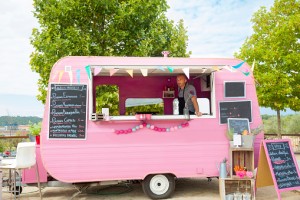
A pastel-colored dessert truck is a must!
These dessert slogans that will remind customers how sweet life can be.
- Even ants would turn their head if they’ll see us.
- Sweeter than home.
- Truck sweet truck.
- Taking our sweet time on the road.
- Your blood carries the glucose. We carry the dessert.
- A glucose-filled truck of happiness!
- Bringing sugar so far.
- Sugary wonders in the wanderlust truck.
- We don’t sugarcoat; we coat sugar.
- Freshly baked seduction.
- Sure, sugar.
- Sugar on shoes; desserts to choose.
- Brownies, cookies, dairy, and everything merry.
- Wants are needs, too.
- Sweet treats for people we meet.
- Queen Ant-approved truck!
- A moving colony of your tastebuds.
- Watch out for the truck. Dine in for the treat.
- We treat you well.
- It’s sweet you to meet you.
- Tweet the sweet treat!
BBQ Food Truck Slogans
What’s more mouth-watering than these sizzling plate of BBQ? Here are marketing slogan ideas perfect for this type of trailer.
- Stick a meat and stick with me.
- Stay for the meat then leave with more treat.
- Fiery meat on wheels.
- MEAT me on the truck.
- Smokin’ and grilling good on the streets.
- We’ll sauce it up for you!
- Sit and grill, eat with thrill.
- A smoke of good time.
- Hot wheels coming through!
- Life is better with BBQ.
- A carnivore’s carnival.
- More meat means more meal!
You Might Like: 250+ All-Time Best Drink Advertising Slogans and Taglines
- Eenie meenie miney meat.
- Smokes, beer, vibes, meat.
- Here’s a ticket to grill.
- Barbecue rhymes with dine-with-you.
- Ride and savor the best grilling experience.
- Moonlight and BBQ are the perfect combination.
- Sizzling, Steaming, Smoking.
- Where there’s smoke, there’s barbecue.
- Better way to play with fire.
- You know I got the sauce.
- Barbecue nights under the streetlights.
- Take your ribs from my cage.
- A great day to grill your way.
- Taste way out of my grill.
- This is your cue to eat barbecue.
Pizza Food Truck Slogans

Classic pizza with parsley and cherries on top.
Serving slices of pizza? Here are some promotional slogans you can use.
- Do you smell pizza?
- Pizza frenzy from a mile.
- Dough. Veggies. Meat. Cheese.
- Travel. Toss. Taste.
- Save a slice, save the world.
- Take the triangle out on a date.
- Never too cheesy nor too meaty nor too veggie.
- Bringing three-sided goodies in four wheels.
- Be a part of our journey.
- Here’s your slice.
- Trucking good pizza.
- Trick your tongue with tri-sided treat.
- Trust the truck with your pizza.
- Dough you wanna bake a pizza?
- Wanna see some magic?
- I want you, dough.
- Leave the grease on the wheels.
- The pizzas on the truck go round and round.
- We will feed you from dusk till dough.
- Bringing the best pizza place in town to your doorstep.
Waffle Food Truck Slogans
Spreading the happiness of eating waffles around the town is a fulfilling journey. Here are slogan ideas relevant to this menu item.
- Tell me more about your waffles.
- You can never go wrong with waffles.
- Your favorite squares on the streets.
- Wheels and Waffles.
- Wake up and Ride Waffle Wheels.
- Mornings on the streets smells perfection.
- Buttery goodness in wheels!
- Belgian dreams at your doorstep.
- There’s always a room for you.
- Lick every square on the street.
- Best days are started sweet with syrup on top.
- Your morning matters to us.
- Better mornings and good waffles.
- Tasting Belgium goodness in every square.
- Eat waffles till your mouth is muffled.
- Muffling goodness in every bite!
- Waffle wanders today.
- Waffle-loving wanderlust.
- Lost in waffle land.
- Take the wonders of waffle with you.
- Free the waffles, fill the square, feel the goodness in your tongue.
- Lose hunger, find waffles.
- Eat well with wheel-traveled waffles.
- Waffle takes you so long?
- Where there’s people, there’s waffles.
- Make way for waffles!
- Would you stop for a waffle?
- Wish a waffle now!
Burrito Food Truck Slogans
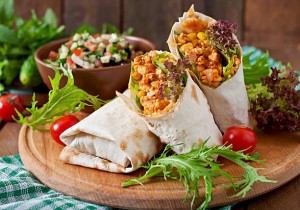
Deliciously Wrapped!
Do you run a burrito truck? Consider using any of these fully wrapped burrito marketing slogans.
- Borrow happiness, buy burrito.
- Bringing burrito goodness to your mouth.
- It’s not bro, it’s burrito!
- Inhale burrito, exhale happiness.
- When in doubt, eat burrito!
- Wish me luck, burrito truck!
- Don’t be hungry.
- See what’s inside.
- Wrapped the world inside for you.
- Walk with your burri-toes.
- Experience Mexico in every bite.
- Take home Mexico with a wrap of burrito.
- Seize the day the burrito way!
- Bored? Wrap a burrito.
- Wrap a treat on your way home.
- Best buy burrito!
- Freshly-made wraps everyday.
- Sink your teeth to this wrapped treat!
- Art in every wrap.
- Everything you need to eat.
Italian Food Truck Slogans
When I think of Italian food, I think of a romantic art cuisine that smells so aromatic I can almost taste it. Here are some ways to describe an Italian food slogan.
- Experience the taste of Italy on the street.
- Pasta to Perfection.
- Love That Linguine.
- Quick Travel To Italia!
- Bringing Tuscany To The Streets.
- Road To Buon Appetito.
- Dancing salsa on the road.
- Pasta A La Truck.
- Rome and its romantic dishes.
- Never disappoints an Italian.
- Chef’s kiss from Kasa to yours!
- A dash of Italy on the road.
- Fancy dishes don’t have to be expensive.
- Fine dining anywhere.
- All is well than ends well with parsley.
- Never tasted a more poetic meal than this.
- Telling stories with Italian pastries.
- Tour Italy anytime!
- Authentic. Aesthetic. Italiantastic!
- Seasoned every season.
- Full course, of course!
- Experience Italian Culture at the tip of your tongue.
- A palette of palatable masterpieces.
Asian Food Truck Slogans
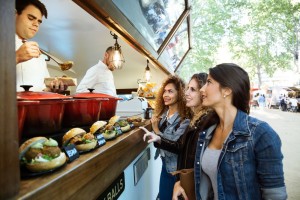
Women waiting for their orders on the food truck.
Asian food is another popular concept for food trucks.
- Spice the day!
- Seize the rice with a dash of spice.
- Stir-fried dishes to grant your wishes.
- Can you take the spice?
- Enrich the soul with good Seoul food.
- Dine downtown.
- If it’s rice, it’s not selfish if you want more.
- Everything made better with rice.
- No such thing as too much MSG.
- No matter where this life takes you, eat rice.
- The road to success has an Asian food truck by its side.
- If your strict parents says “no”, bribe them with our food.
- Get better grades with our grade A meat dishes!
- Cheating is good if it’s a cheat day with the best Asian food.
- “Eat well” delicacies at its finest!
- Spicier than the Summer.
- Summer medley tastes from all over Asia.
Filipino Food Truck Slogans
The iconic Filipino adobo.
Filipino dishes are one of the best-tasting food in the world, period! If you plan to spread the Filipino goodness with your food truck, consider these catchphrases.
- Slippers will fly when the food truck comes by.
- Jeepney food tastes classic.
- Lechon Riding On Wheels.
- Taste On Truck. Taste On Home.
- Can you eat all you can?
You Might Like: 301+ Cake Business Marketing Slogans and Quotes that Increase Sales
- Serving nostalgic foods that your grandma used to make.
- The Boodle Way.
- Ride on our moving Bahay Kubo to taste authentic Pinoy delicacies!
- More than Adobo and Bulalo.
- Get the rice!
- Makes you squirm your face in thrill!
- You’d wish you’re in the Philippines for more.
- Everything goes well with Philippine lime.
- Pass me the soy sauce, please.
- Foreignly native and natively foreign.
- A melting pot of flavors.
- Taste Sweet-sour-spicy-salty delicacies in one bite!
- Casually passing by with mouth-watering Filipino dishes.
- Anything you would like to try.
One of the exciting industries with which you can quench your entrepreneurial spirit is the street food industry. Food truck is a profitable way to unleash your creativity in the kitchen, but don’t forget about the importance of marketing.
The global market size of the food truck industry has grown in value to $3,930,000,000 in 2020 and is expected to grow at Compound Annual Growth Rate (CAGR) of 6.8% from 2021 to 2028. This is an industry positioned to grow well into the end of the decade.