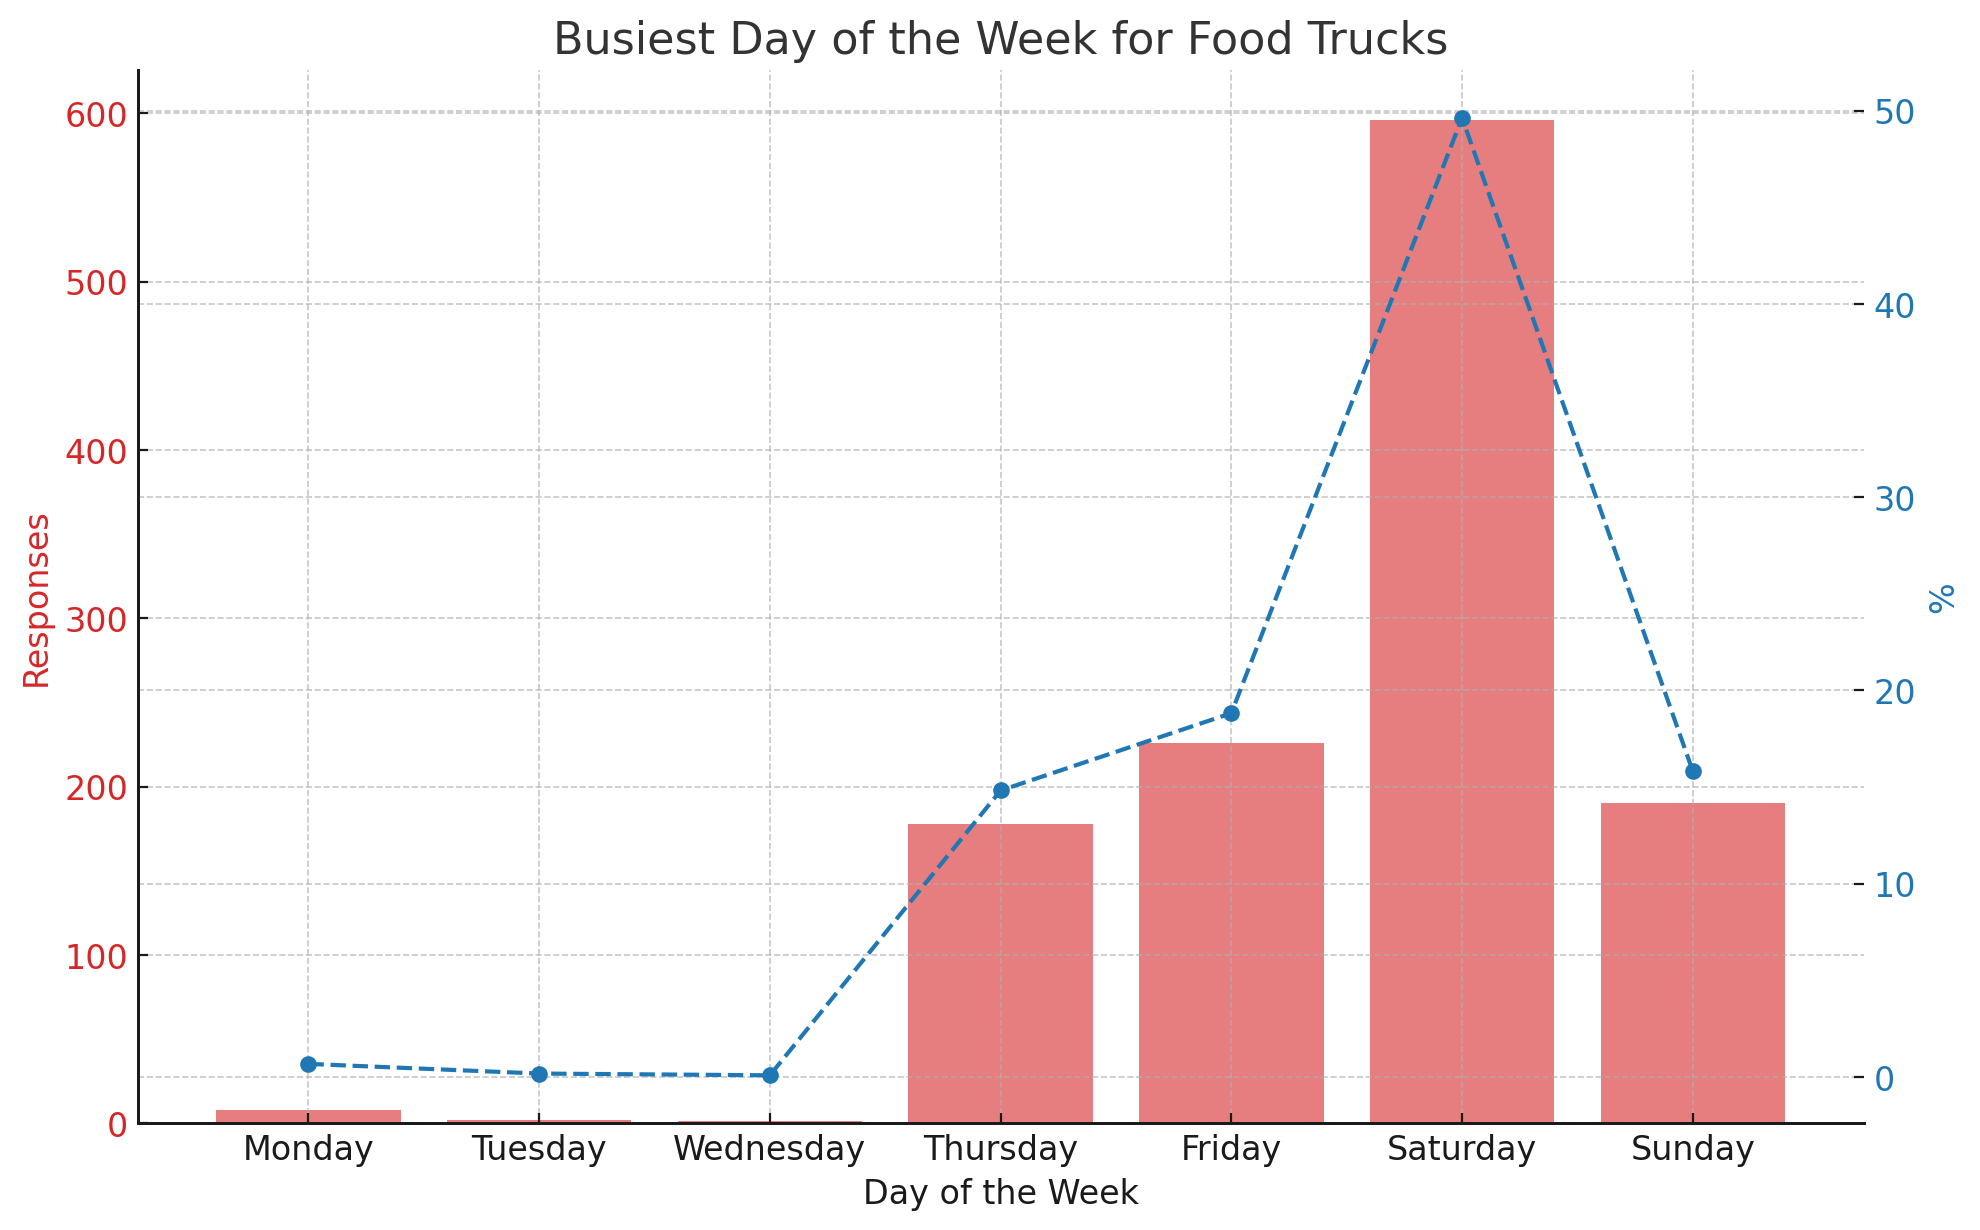
In this week’s poll, we asked mobile food vendors what day of the week was their busiest. The findings of the 1,021 response survey is clear, but perhaps not too surprising. The busiest days for food trucks are on the weekend. Nearly half of the total respondents said Saturday was the busiest day of the week.
Survey Responses: Busiest Day
| Day of the Week | Responses | % |
|---|---|---|
| Monday | 8 | 0.67% |
| Tuesday | 2 | 0.17% |
| Wednesday | 1 | 0.08% |
| Thursday | 178 | 14.82% |
| Friday | 226 | 18.82% |
| Saturday | 596 | 49.63% |
| Sunday | 190 | 15.82% |
Smaller restaurants often close on Mondays and Tuesdays because it’s not profitable to cover the necessary staff. This is true for many mobile vendors as well. Many operators use these days for time off or to catch up on work.

My Takeaways from this Survey
Here’s how you can use this data to grow your business.
- Weekend Focus: With Saturday (49.63%) being overwhelmingly the busiest day, followed by Sunday (15.82%) and Friday (18.82%), it’s clear that weekends are prime time for food truck operations. Owners should prioritize staffing, stock, and location planning to capitalize on the increased foot traffic and demand during these days.
- Strategic Planning for Weekdays: The sharp drop in responses for Monday through Wednesday suggests lower customer turnout on these days. Food truck owners might consider using these slower periods for restocking, maintenance, and administrative tasks. Alternatively, this could be an opportunity to explore catering, private events, or partnering with local businesses for weekday lunch services.
- Thursday as a Pre-Weekend Opportunity: Thursday shows a significant increase in activity compared to earlier weekdays, indicating it could serve as a “pre-weekend” day with potential for special promotions, themed nights, or collaboration events to draw in crowds.
- Plan Time Off for Monday and Tuesday: In my experience, dedicating Mondays and Tuesdays for light administrative duties like bookkeeping or responding to emails and taking a break is a smart move. After all, you need time to rest even if you run a business. From an ROI perspective, the effort and resources spent operating on these slow days often don’t match up to the potential earnings, making it more sensible to focus on preparation and administrative tasks instead.
Do you agree with these takeaways? I’d like to know what you think about this analysis by reaching out to me on social media.
Survey Methodology
Objective: The primary objective of this survey was to gather insights into the busiest days of the week for food truck vendors across the United States, encompassing a broad range of mobile food vendors, from food carts to food trucks and trailers.
Survey Tool: Data collection was conducted using Survey Monkey, a leading online survey platform that enabled us to design, distribute, and analyze the survey questions.
Population: We surveyed mobile food vendors operating in the United States only. This ranged from traditional food trucks and food carts to modern food trailers.
State-Specific Data: The survey responses were predominantly from five states, which are key players in the food truck industry:
- California: 320 responses
- Florida: 250 responses
- Texas: 210 responses
- Minnesota: 150 responses
- Washington: 130 responses
Data Collection Channels:
- Direct Messaging on Facebook: We leveraged Facebook’s vast network to identify and directly message food truck vendors, inviting them to participate in our survey.
- X (Social Media Platform): Utilizing another prominent social media platform, X, we engaged with vendors through posts and direct outreach to increase our survey’s visibility.
- Website Forms: On relevant food industry websites, we placed survey forms to capture responses from visitors who are actively involved in the mobile food vending business.
- Newsletters: We sent out invitations to our survey through newsletters, targeting subscribers who are part of the food truck community or have expressed interest in food industry trends.
Response Rate and Collection Period: The survey was open for responses over a period of four weeks in January, 2024. During which we received a total of 1,201 responses from mobile food vendors across the country.
Data Analysis: Upon closing the survey, data was exported from Survey Monkey for analysis. We employed descriptive statistics to evaluate the responses, specifically focusing on identifying trends related to the busiest days of the week for food truck operations.
Ethical Considerations: All respondents participated voluntarily with an emphasis placed on anonymity and confidentiality. Participants were informed about the purpose of the survey and how the collected data would be used. No one was paid to respond to this survey. There is no third-party paying for this to be conducted.
Limitations: This survey was only sent to operators in the United States. Other countries may have different busy days of the week. The responses may reflect the perspectives of those more inclined to participate in online surveys. We are a small team and can only reach out to so many vendors. Reaching out to more people would yield more accurate results.
At Mobile Cuisine, we’re always gathering unique data about the food truck industry. One ways we do this is by reaching out and asking questions to active food truck vendors on social media and websites. If you are a mobile food vendor and want to be notified about future surveys and polls, sign up for our newsletter.