Are you a food truck owner who uses the built in Twitter analytics tool? Are you looking for new ways to measure your food truck’s success on Twitter? The Twitter analytics tool gives you access to data that third-party services can’t.
Today I’ll show you how to gain access to Twitter Analytics and find the data you need to track your food truck’s Twitter success.
Accessing Twitter Analytics
Much like other social media platforms, the Twitter analytics feature is designed to be used by potential paying customers. So in other words, only accounts with Advertiser status can access Twitter analytics data.
If you don’t already have an advertiser account, you can request advertiser status by going to https://analytics.twitter.com. You’ll have to submit some information about your food truck business, including payment information.
Now you need to set up a Promoted Tweet or Twitter Card campaign. However, if you set the campaign to run later, you can cancel it once you gain access to Analytics to avoid having to make a payment.
Log in to see the Twitter Analytics dashboard once your food truck’s account is changed to advertiser status, . You now have access to five distinct sections: Home, Tweets, Followers, Twitter Cards and a drop down menu for Tools. Today we’ll discuss the two most important Twitter Analytics sections:
Twitter Analytics: Tweets Dashboard
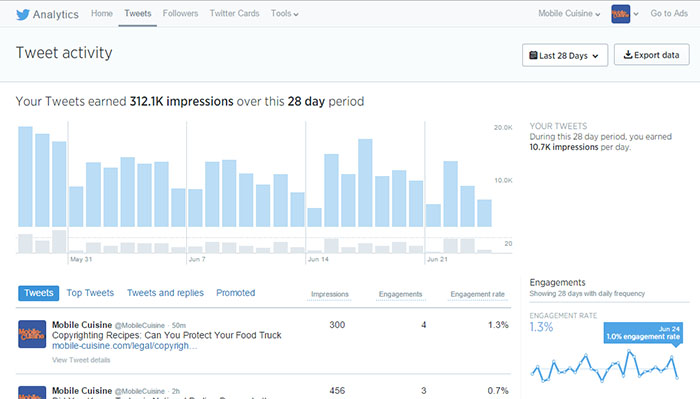
The tweets dashboard is the best place to find detailed information about how your outgoing messages are performing. At a glance you can see the month’s interaction and the best tweets you sent out.
The top graph on the page shows the past month of activity in terms of mentions, follows and unfollows. You can also see daily performance (hover over the date you want more information for).
Under the graph is a section that highlights all of your recent tweets and details the impressions, engagement and engagement rate associated with each tweet.
In the right sidebar you can see engagement over the last month. Use this data to figure out which days showed the best performance and replicate the tactics used on those days.
If you want to compare this month’s data to past data, you can download a CSV file (click Export Data) with details on tweets for the past several months.
You can then use that data to determine whether interaction has changed, what content your followers interacted with most and when they interacted with it.
Twitter Analytics: Followers Dashboard
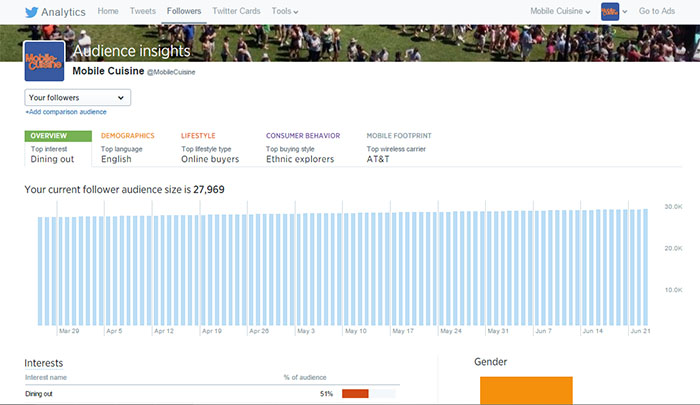
The Followers component of Twitter Analytics offers insights that third-party services can’t necessarily provide. In addition to tracking follower increases and information on gender and location, the Followers dashboard is the easiest way to find out which topics your followers find most interesting.
Track your audience’s changing interests so you will know what areas you should focus on for both original content and the content you retweet.
The Follower dashboard also shows you the top ten accounts your followers follow, ranked by percentage. Use this insight to better understand what kind of information your followers are interested in on Twitter.
RELATED: Is Your Food Truck Twitter Account Spinning It’s Wheels?
The Bottom Line
We hope that you now understand how each of the Twitter Analytics dashboards offers specific data you need to track campaigns and your overall food truck Twitter account success. Being able to dig into your Twitter data for a deeper look at what’s working and what’s not is an important factor in promoting your food truck brand on Twitter.
Have you used Twitter Analytics? We’d love to hear your thoughts on what features do you find the most useful? Share them in the comment section, our food truck forum or social media. Twitter | Facebook.